Line of Sight (LOS)
LOS is a Rust project that generates a map showing which areas are visible from a given location. In GIS terminology, this is called a viewshed.
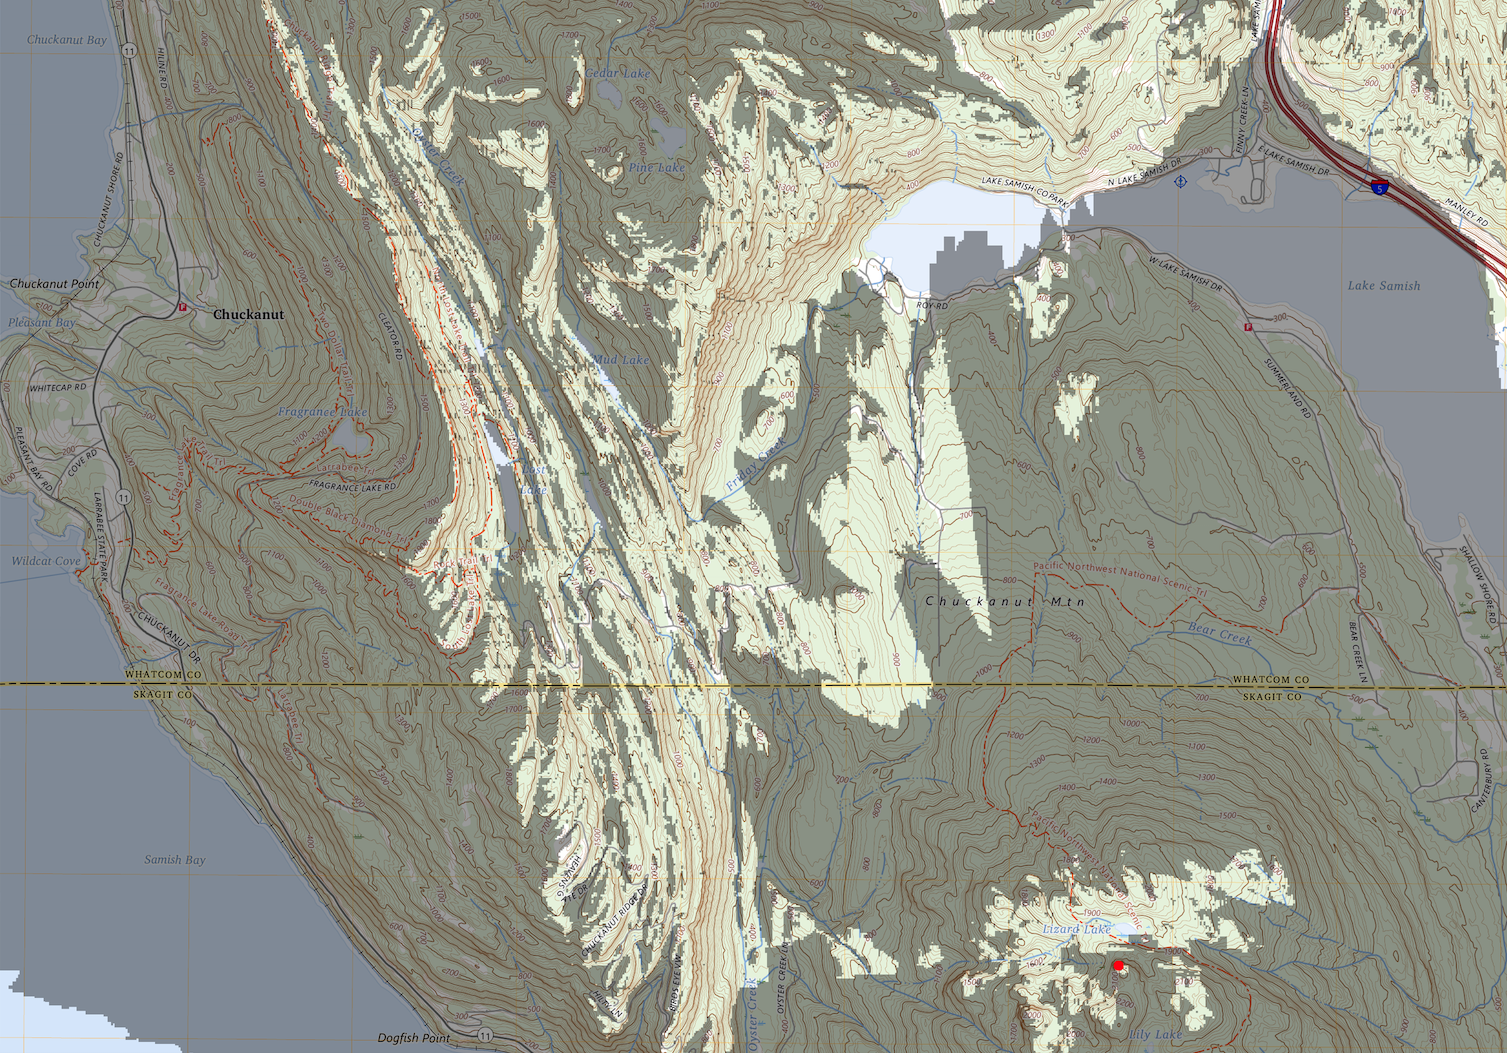
The basic idea is pretty simple: enter a latitude and longitude, fetch elevation data for the surrounding area, calculate whether nearby points have a clear line of sight from the original point, and render the result on top of a topographic map. Visible areas are left alone, blocked areas are darkened, and the original point is marked in red.
Inspiration for this project came from hiking with topographic maps. Many times I have gotten to an impressive viewpoint, and despite some practice with topo map reading, have only been able to make educated guesses at what geographic landmarks I was able to see.
This project became a great opportunity to get more familiar with practical GIS tooling: working with public elevation datasets, raster data, coordinate transforms, map sources, and the performance tradeoffs that come with processing geospatial data.
It began as a command line tool, but has since grown into a small web app with a static frontend and an API server.
The code is available on my GitHub, and the interactive application is available here.
How it works
The project uses USGS elevation data as its source of truth for terrain. The default implementation streams 1/3 arc-second DEM data from the USGS 3DEP seamless VRT dataset using GDAL. That means the app does not need to download a full elevation dataset up front. Instead, GDAL fetches the relevant byte ranges from remote GeoTIFF tiles as needed.
For each request, the library first finds the 7.5-minute USGS topographic map that contains the selected coordinate. It downloads and caches that GeoPDF locally, then uses the map's geographic bounds to prefetch the corresponding elevation data. This GIS data wrangling ended up being a substantial piece of the project: aligning map and elevation data means working with bounding boxes, raster windows, coordinate transforms, and several geospatial file formats.
The line-of-sight calculation runs over a grid covering the map. For each point in the grid, the library recursively samples midpoint elevations between the viewer and target point, checking whether terrain rises above the straight line between them and obstructs the view. Visible areas are preserved in the final image, while blocked areas are darkened.
Once the viewshed is calculated, the highlighter reads the RGB bands from the topo map, applies the visibility mask, marks the original coordinate, and writes the final image.
Performance
After getting a naive solution working, the project became an iterative search for bottlenecks and approaches to remove or reduce them. The first pass took several minutes to produce a map. It now takes around 20-25 seconds without a primed cache, and can be as fast as ~8 seconds for repeated requests in nearby areas.
The viewshed calculation is embarrassingly parallel, since each point in the output grid can be checked independently. Rayon was a clear solution here, and after a small refactor to prefetch elevation data into memory before the grid loop, it was a near drop-in performance enhancement. The highlight step also uses Rayon when applying the viewshed to the rendered map image.
The library caches a few expensive pieces of work.
USGS topo maps are cached after first download, and prefetched GDAL DEM handles are serialized to disk with postcard.
This makes repeat requests for the same source and bounding box much faster.
The biggest remaining bottleneck is the topo map rendering path. The current implementation uses GDAL to rasterize USGS GeoPDFs and read their RGB bands, which works, but is slower than I would like. A likely future improvement is to move away from GeoPDFs entirely and use USGS topographic map tiles instead. This will also allow for centering the output image on the requested point, rather than relying on the bounding boxes of the 7.5-minute maps.
Interfaces
LOS can be used as both a CLI and a web app.
The CLI supports elevation lookup, point-to-point line-of-sight checks, terminal viewsheds, and full map highlighting. The web server exposes a highlight endpoint that returns a PNG, and serves a small static frontend for entering coordinates and viewing the result.
The frontend is intentionally simple. It has coordinate inputs, a current-location button, a random-location button, and a pan/zoom image viewer for the generated map. The UI is intended to make the project easy to demo, while keeping the core geospatial work in the Rust backend.
The web app is deployed on Fly.io, which made it easy to demo the project without distracting from the core GIS problem.
Future work
There are a few directions I would like to keep exploring.
The most obvious one is replacing GeoPDF rendering with map tiles: small, pre-rendered map images that can be stitched together for a chosen area and zoom level. That would simplify the rendering pipeline, reduce render time significantly, and allow for centering the output around the requested point.
I would also like to make GDAL optional eventually. Right now it is extremely useful because it can handle remote VRTs, GeoTIFFs, GeoPDFs, projections, and raster windows, but it is also a large native dependency. A pure-Rust path for smaller downloaded DEM tiles would make the project easier to build and deploy.
There are also some small configurability improvements I would like to make, like configurable viewer height and resolution.
Finally, the library currently does not account for earth curvature, which means the output may be less accurate over longer sightlines.